 Türkçe
 Deutsch
What Is a Balance Sheet and How Do You Prepare One?
Being able to read a balance sheet is one of the basics of financial literacy. In this article we look at the main components of the balance sheet and how to prepare one.
A step-by-step look at the balance sheet and how to prepare it
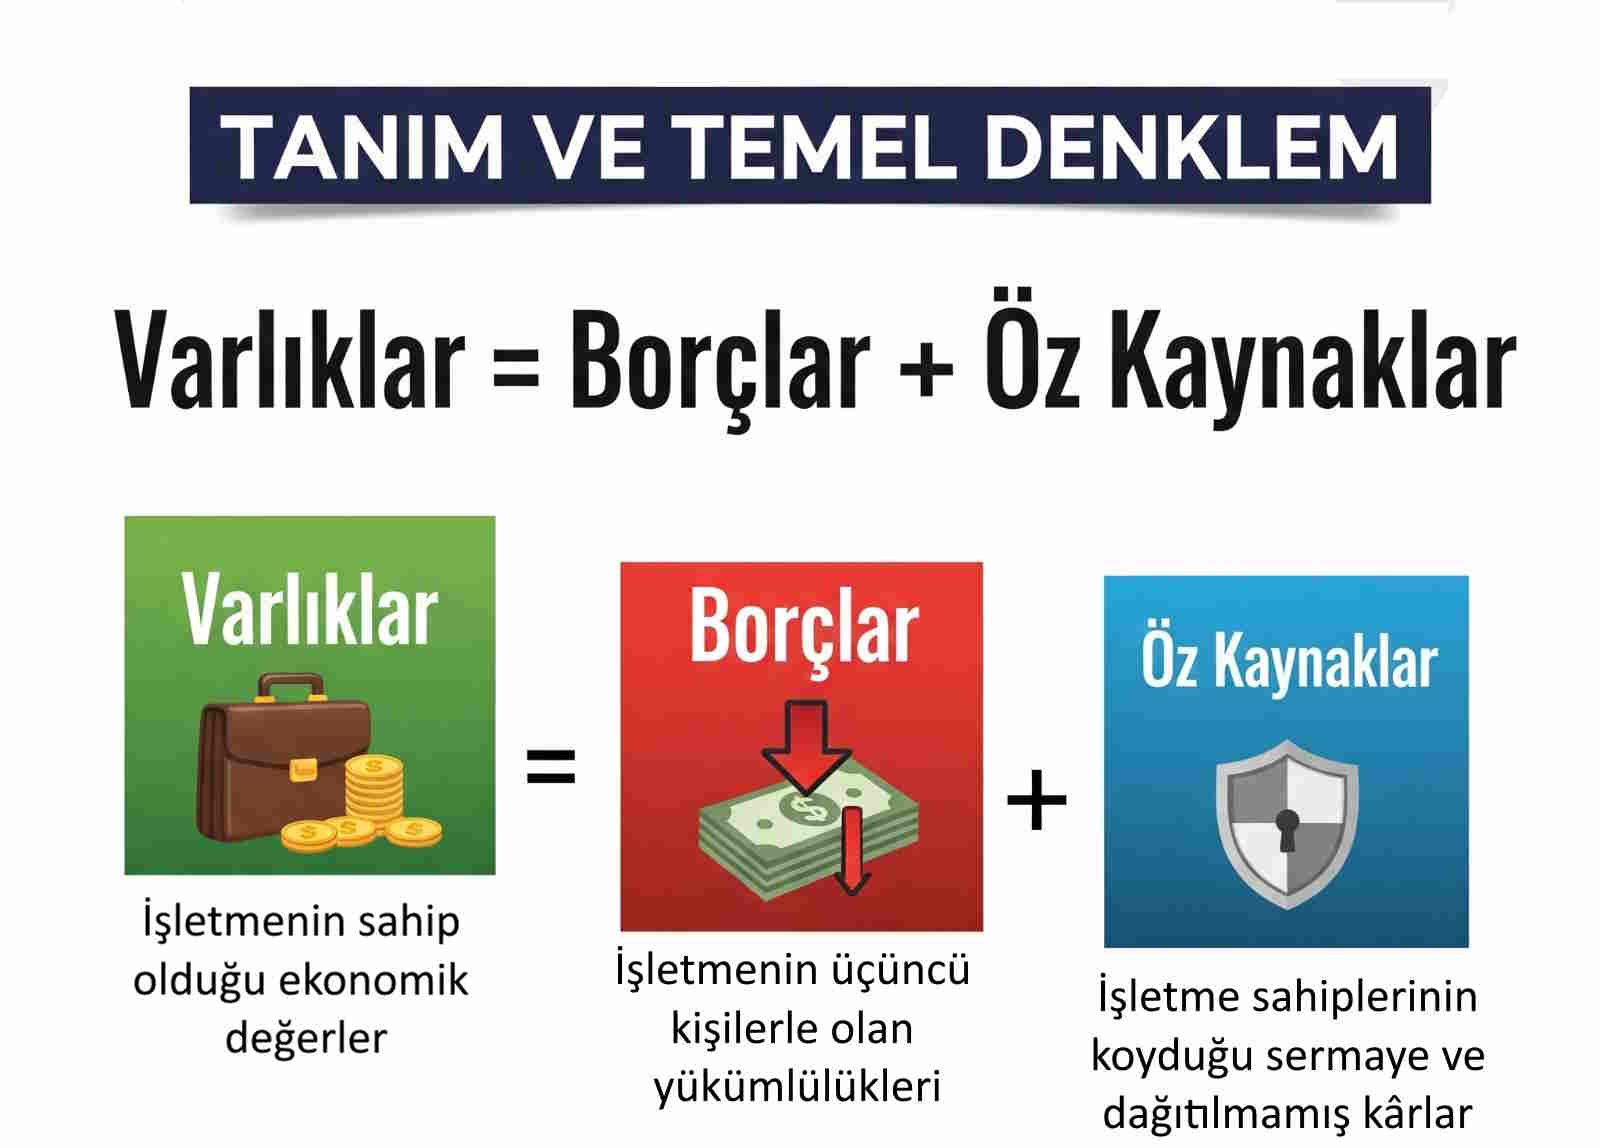
The balance sheet is a core financial statement that summarises the financial position of a business or company on a specific date (usually the end of the period). It is built on the principle of balance and shows the company's assets, the liabilities (short- and long-term borrowed funds) that finance those assets, and its equity (the capital put in by the owners and the profits accumulated over time).
The balance sheet is not just a legal requirement. For managers, investors and other stakeholders it is also one of the most important references on the financial health of a business.
A balance sheet always balances according to the formula Assets = Liabilities + Equity, which is the foundation of double-entry bookkeeping. This equation guarantees that the left side of the balance sheet (assets) is exactly equal to the right side (liabilities and equity). It shows clearly that everything the business owns has a source of financing, and where that financing comes from.
Assets: what the business owns
Assets are everything the business owns that is expected to bring economic benefit in the future. Everything from the cash in the till to the machines in use, and even a patent, falls under this heading. Assets are divided into two main groups according to their liquidity, that is, how quickly they can be turned into cash.
Current assets
Current assets are assets that are expected to be turned into cash, used or consumed within one year or within the normal operating cycle. They show whether the business can meet its short-term obligations, which makes them very important for liquidity analysis.
- Cash and cash equivalents: cash on hand, bank deposits and short-term investments that can easily be turned into cash (money market funds, for example). This is the most liquid asset a business has.
- Trade receivables: amounts not yet collected for goods or services the business has sold. Money owed by customers is the most common example.
- Inventories: raw materials, work in progress and finished goods held for sale. Managing inventory well is critical for profitability.
- Other current assets: other assets that do not fit the items above but will be turned into cash within a year, such as expenses paid in advance for future periods or other receivables.
Non-current assets
Non-current assets are assets used in the business for more than a year and not held for sale or consumption. They reflect the long-term strength and investment structure of the business.
- Property, plant and equipment: physical assets used in operations. The most common examples are land, buildings, machinery, vehicles, fixtures and production facilities. Because some of these assets wear out, the balance sheet shows them at their net value after depreciation.
- Intangible assets: assets with no physical form that still bring economic benefit, such as patents, licences, copyrights and goodwill. These assets are also amortised over a set period.
- Financial investments: financial assets such as shares or bonds that the business plans to hold for more than a year as a profitable investment.
Liabilities and equity: sources of financing and obligations
The right side of the balance sheet shows the sources the business uses to finance its assets. Every asset of a business is financed either by debt from third parties (liabilities) or by the owners' own capital (equity).
Current liabilities
Current liabilities are debts the business has to pay within one year or less. They need to be followed most closely when it comes to liquidity risk.
- Trade payables: amounts owed to suppliers of goods and services.
- Bank loans (short-term): bank loans due for repayment in less than a year.
- Other current liabilities: other short-term obligations such as salaries and wages owed to employees and taxes and social security contributions owed to the state.
Non-current liabilities
Non-current liabilities are debts due in more than a year. They are usually the financing a business uses for investment projects or growth. The most common examples are long-term bank loans and bonds issued by the business.
Equity
Equity is the net value left after all of the business's debts are paid. It represents the owners' (partners') share in the company. The stronger the equity, the sounder the business is financially.
- Share capital: the capital the owners have put into the business since it was founded.
- Reserves: profits set aside, by law or by company decision, for possible future losses or investment needs.
- Retained earnings and profit or loss for the period: profits or losses carried over from previous years and the net profit or loss earned in the reporting period. At the end of the period this amount is added to or deducted from equity.
How do you prepare a balance sheet?
Follow these steps to prepare a balance sheet from the final trial balance at the end of the period. The account numbers below follow the Turkish Uniform Chart of Accounts.
- Write the total debit balances of accounts starting with 1 on the left side as "Current assets".
- Write the total debit balances of accounts starting with 2 on the left side as "Non-current assets".
- Write the total credit balances of accounts starting with 3 on the right side as "Current liabilities".
- Write the total credit balances of accounts starting with 4 on the right side as "Non-current liabilities".
- Write the total credit balances of accounts starting with 5 on the right side as "Equity".
Check that the grand total of the left side equals the grand total of the right side. In accounting, this equality means that every asset has a source. If the totals do not match, check your final trial balance, and if necessary go back as far as checking that debit and credit totals match on every journal entry in the period.
In accounting software such as Noyax, every journal entry is checked before it is saved, so the balance sheet can be prepared with a single click.
A balance sheet example: putting the concepts into practice
To make the topic easier to follow, let us look at a simple balance sheet.
ABC LTD: SIMPLE BALANCE SHEET (31 December 2024, TRY)
| Assets | Amount | Liabilities and equity | Amount | |
|---|---|---|---|---|
| Current assets | 800,000.00 | Current liabilities | 450,000.00 | |
| Cash and cash equivalents | 150,000.00 | Trade payables | 200,000.00 | |
| Trade receivables | 350,000.00 | Bank loans | 250,000.00 | |
| Inventories | 300,000.00 | |||
| Non-current assets | 1,200,000.00 | Non-current liabilities | 550,000.00 | |
| Machinery and plant | 1,000,000.00 | Bank loans | 550,000.00 | |
| Vehicles | 200,000.00 | |||
| Equity | 1,000,000.00 | |||
| Share capital | 800,000.00 | |||
| Net profit for the period | 200,000.00 | |||
| TOTAL ASSETS | 2,000,000.00 | TOTAL LIABILITIES AND EQUITY | 2,000,000.00 |
In this example ABC Ltd has total assets of TRY 2,000,000. TRY 450,000 of these assets is financed by short-term debt, TRY 550,000 by long-term debt and the remaining TRY 1,000,000 by the owners' own funds (capital and profit). The balance sheet balances: TRY 2,000,000 = TRY 450,000 + TRY 550,000 + TRY 1,000,000.
Balance sheet analysis: how do you measure the health of a business?
On its own, a balance sheet says little. Its real value appears when it is interpreted and analysed. A number of analysis methods turn the figures on the balance sheet into meaningful information.
Vertical analysis (percentage method)
This method looks at each balance sheet item as a percentage of total assets (or total liabilities and equity). It is used to understand the structure of the assets and how the sources of financing are distributed. For ABC Ltd, comparing the share of current assets in total assets (40%) with that of non-current assets (60%) shows that its asset structure relies more on non-current assets.
Horizontal analysis (comparative method)
Horizontal analysis places balance sheets from different periods side by side (2023 and 2024, for example) to see how each item changes over time. It reveals performance trends such as how fast inventory is growing, how quickly debt is falling or the rate at which assets are increasing.
Ratio analysis
This is one of the most widely used methods. Ratios between balance sheet items measure how the business performs on liquidity, profitability, financial structure and operating efficiency. For example:
- Current ratio (liquidity ratio): current assets / current liabilities. It shows the ability of the business to pay its short-term debts.
- Debt-to-equity ratio: total liabilities / equity. It shows how much debt the business uses to finance itself and how risky its capital structure is.
With these methods, the balance sheet stops being just a table and becomes a road map that sheds light on the future of the business.
Conclusion and recommendation
This article set out to strengthen your financial literacy by explaining the balance sheet step by step. Remember that understanding the financial health of a business starts with the basics: reading the balance sheet.
By following the summary and detailed balance sheet reports that Noyax prepares in one click, period after period, you can monitor the financial health of your business reliably.